
Day 2 Session Notes–10k Screens Later: How We Became a Data-Driven Design Organization

— Thank you very much for this time, and thank you for the cohort for this fantastic opportunity
- Will see a lot of graphics in this talk
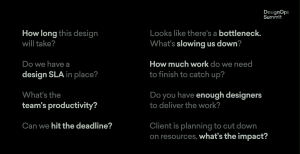
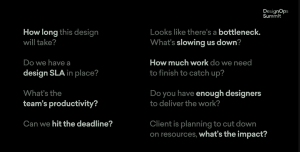
— Will start talk to look at following questions and lot of these are familiar, so question is how confident you are in answering them
- The expectation that you should know answer one way or another
— Inevitable feeling of anxiety that comes in with answering questions and where to even begin
- Questions depend certainty to uncertain things

— For two decades, I have been searching for ways to reliably answer these questions
— Dabbled in statistics and data analysis to make sense of madness and always felt incomplete or unreliable and something was missing

— Let me introduce myself as designer for 20+ years and who has been fortunate enough for his work to have been recognized by millions of people
—But will share something more personal
- Country where being designer is relatively new, and from middle-class family, where was eldest at five and might as well work in family business
- Convenient but not exciting, so founded own design company
— Frost design is Filipino led design company and run together with wife and close friend
- Major digital transformation across Philippines
— Led UI redesign of #1 fin-tech app, and improved 90% of NPS score through increased ease of use
- Major digital experience overhaul for telecommunication companies
- But design and creative work are treated as nice-to-have instead of must, so we need to raise overall value
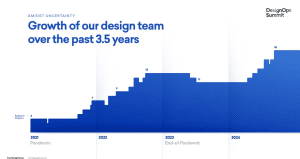
— Increasing growth and value of design team and as of today have 21 designers for three groups with design arts and animation
- Going remote realized how to make team work
- Full remote allowed us to hire talent across the country, and talk contains approach we learned along the way

— Delivered 10k screens with ground-up designs with no design systems support
- Why this much? No one will pay us if we don’t
— This much delivery is only way to raise value
- Topic for different day.
— Need to hit speed, quality, scale in order to be competitive to optimize for delivery
- Get same result with less effort which led to breakthrough
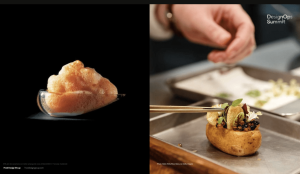
— Inspired by Michelin restaurants that can deliver complex dishes each time, with mix of precision care and craft
- Want to emphasize this
— Instill values and reinforce value
— Speed from craft the right way and automations help assist practicioners
— So go back to these questions
- Tried a lot and path filled with disappointment, until recently I got results

— But will show results and three key areas
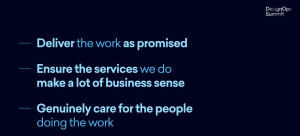
— Care for people doing the work

— Forecast delivery dates with 95% certainty factoring in ongoing performance
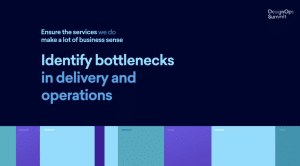
— Bottlenecks in process
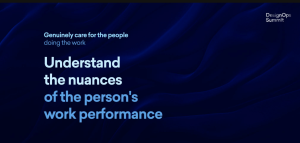
— We need to understand nuance of performance
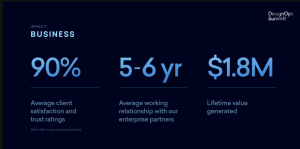
— As for impact?
- 90% client satisfaction and trust rating and 5-6 year working relationship with most clients and 1.8 million in lifetime value
— Bottom line
- Net positive for next 7 seven years
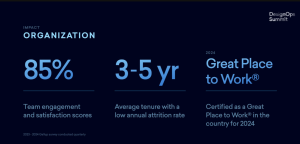
- 85% engagement and satisfaction score
— 3-5 years is our average employee tenure, and we have been honored to be certified as great place to work for 2024
— How did we get here?
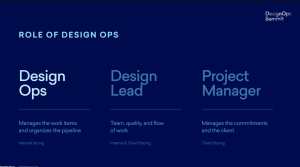
- DesignOps was critical for this result, and practice grew from team of 1 to 3 paid intricate dance to enable work at scale
— Since operationally driven we will work items in organized pipeline to focus on team, quality and flow of work and PM to manage commitment to client
- One single mandate of giving designers more time for design and remove distractions
— See where work is and how well it’s done
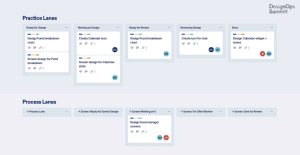
- Turn to Kanban methodology to move away from two-week sprint to more fluid continuous delivery

— Deal with a lot of cards and move across multiple lanes with
- 48 lanes and 3,000+ cards
— Average of two minutes to finish each significant card
— Rub is that capturing and tracking is work, and will be job in itself, so we need to make it feel natural and deliver same result

— Found solution in Figma comment box and super-charged
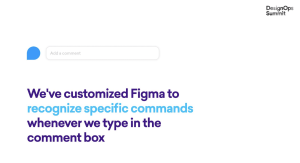
— Recognized to capture specific commands when something is in a comment box
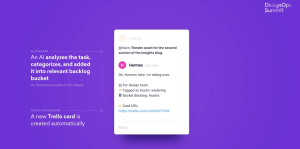
— After posting comment a bot will reply and AI will put through relevant backlog and leave it as reply
— Translates to Trello card and tag based on classification and sounds great
- This takes 30 seconds to finish, and no new plug-ins and feels like magic
— Also created various tags for cards but how to move work forward
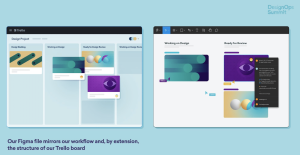
— File visually represents workflow and mirrors structure of board
- Regardless of scale, people know where work is and how close to being done
- Don’t need to ask for work status

— Design functions as team support and we rely on doing right thing, all while operating in Figma, and parts on Trello
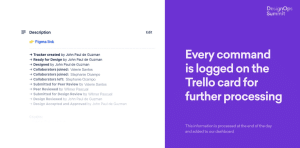
— Every command is logged for further processing and production team can see everything in Figma
— Catalyst to move work with various resolutions and granularity
— Trackers for work and see work in context of entire process

— Data pipeline is simple, for Nave for Kanban, pipe dream data orchestration, sheets for dashboard
—Why care?
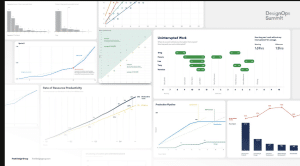
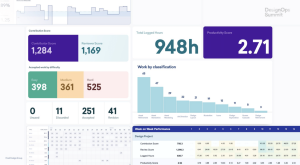
- When work captured effectively, and tracked in real-time, we get real-time results
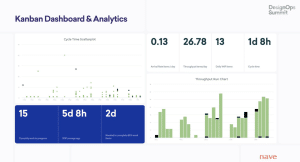
— Dashboard provides actual insights and guessing game from operations and managing volatile curveballs and annoyance

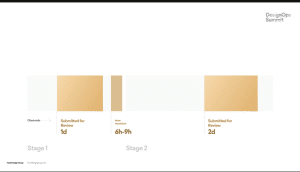
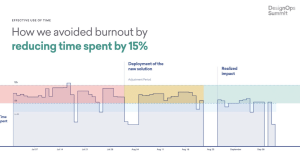
— Often, if we ask what is slowing us down, we get monolithic time charts
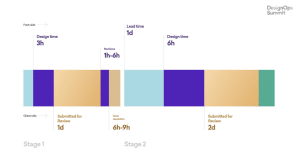
— Work looks like bands of time showing different stages of work, and where the time goes
- Example of asset production and deduce bottlenecks in process
— Can ask questions of longer lead time for Stage 1 or stage 2
- Stage 2 is more labor intensive to refine all details and fewer unlimited resources for doing work
- Allows us to recalibrate work and how it should flow
- Shorten lead time, more resource to work and perform stage items
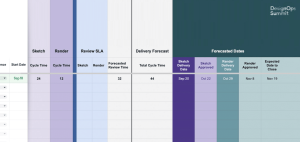
— Need to understand external factors to limit us from moving forward and preparing delivery schedule to better collaborate and communicate with clients to understand better
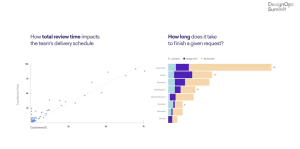
— Values and delivery and use that to build models and scatter plot and total time for partners
- Distribution of lead time and reply time to show where time goes
— Help figure out what matters most on any day
- Bonus is seeing where to finish work
— Where can we deliver?
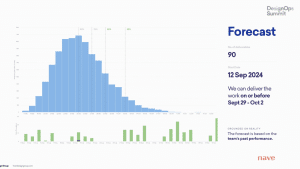
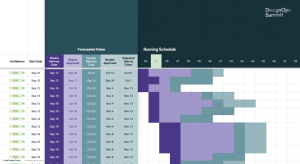
— To answer this we run Monte-Carlo simulations for when to commit team throughput, and various scenarios and probabilities for decision making process
- Recalibrate for details as things form up and moving work forward and put in more people to improve odds of success

— No more guesstimates but a far more reliable results
— What about forecasting output for delivery this year?
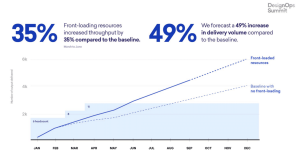
— Requesting justification for resources early on and plot baseline trends and pull into simple linear forecast for the rest of the year and whopping 49% increase and increase in output and gave confidence and value of service and be a step ahead
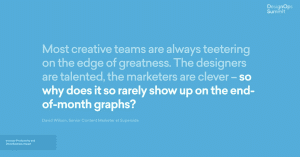
— Most creative teams are on edge of greatness so why doesn’t show it up in metrics?
- We need to learn to quantify value to deliver
- Bigger agencies and designers out there
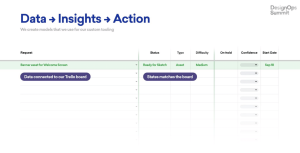
— Learned that we need to provide data insights and action and a time
— Publish details from models to number of days
— Dynamic loading helps adjust to conditions of design delivery
— Systems to measure and view work, and come up with relationship between data points
- Sounds like surveillance, but this data is supposed to be neutral
- Way and context of data brings information to bring good or harm

— Need to view culture and values of human judgment to make sure people see information in right way and data gathering
— So how do we deliver this and evaluate our performers, and minimize layoffs
- Care about human side of things
— Insights allow us to grasp current capability and providing realistic expectations for schedule and workload
- Running people into ground is bad for business
— Since managing lot of designers, need to measure productivity objectively not just output, but also factors of time

— More time doesn’t make you automatically product, and risk of rigging system in favor of quantity over quality
- Shouldn’t be favoring people how log more time compared to others , and sense of false productivity
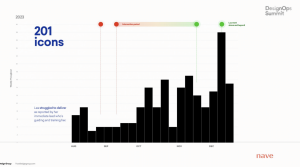
— Data to identify relevant help and how to support and example of Leia as junior designer and immediate lead and receive two journal-entry callouts
- Guided intervention and intentionally hold throughout the process
— Receive great feedback mid-November and by end of year
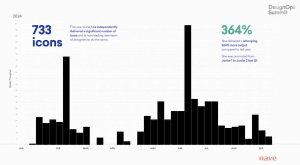
— For 2024 delivered 733 icons that were design reviewed and client perspective and highest last year is baseline knowledge
- Designer promoted from Junior I to Junior II
— To deliver at scale we need to use time well, and not just appear busy
— Spending more time doesn’t make you more productive and doing more than the rest
- Case study of employee who pulled 11-12 hours daily and should have been ecstatic, but realized why spending so much time given automation in place
— Found doing manual consolidation of work, and asked DesignOps to remove manual work, and short period of adjustment went back to normal range

— At end of day, our employees are people with hopes and dreams and parents who wanted them to be accountants or lawyers
- Keep challenging them
- Be fair in expectations
- While respecting their uniqueness
— Using data to incentivize and promote silent producers to show value of contribution, even if not loudest person in room
- Protect people against unfairness and world filled with workplace injustice and creating equitable workplace
— Demand systems and process for fairness and perspective to offer and how to genuinely care for people doing the work

— We are always improving and in V4
— Know Peter Drucker’s work fitting for this, but let’s focus on 1% better each day, to make us push forward and hope gave clear example of how design org can be competitive advantage
- Inspiration for your org
— True obsessions to elevate work and embrace weakness of individual along with fantastic value for service and premium and elevated value of design
- Despite immensity of challenge, believe it is worthy mission to follow
— Hope you learned something

— Thank you and have a great day. Salamat, as they say in the Philippines!
