AR2021-Using Research to Determine Unique Value Proposition (Edgar Anzaldua Moreno, Sniip)
—> Hi my name is Edgar, and I’m here to help you figure out the Unique Value Proposition (UVP) of your research
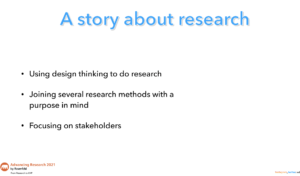
—> This talk is about how design thinking can be used to inform design research
—> Most importantly, how to do this with a stakeholder-centric approach, since he believes research should be done the same way products are built, i.e. user-centric or delivering values
—> Have done research as part of design manager role in past areas, and I worked with companies like Autotrader and Canon
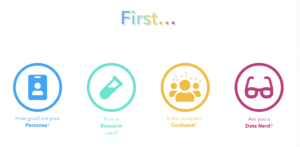
—> Before we start, ask yourself if you are Involved in creating research that is not used or misused, or people in your company are confused as to who your users are
—> Also, ask if you are a data nerd. If you are, you will enjoy this presentation
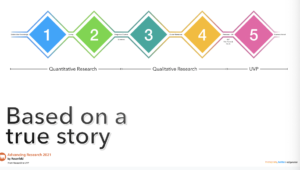
—> This technique is based on a true story as I moved from quantitative to qualitative analysis to find out value within context of business model
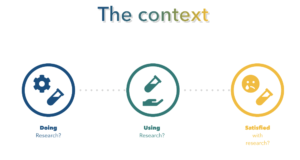
—> I noticed when I joined past companies, no one was doing research, which indicated need for research
—> Or research was around but not being used
—> Stakeholders were also vocal that quality of research was not good
—> As a rule, when stakeholders are excluded form how you produce research, all of these effects are likely to happen
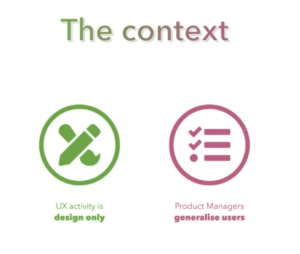
—> UX also tends to be an expert design approach, with designers focusing on aesthetics
—> Research is treated as second priority, with product managers making generalizations about users, and not understanding a target audience
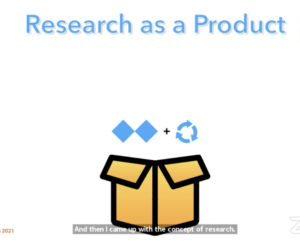
—> So I came up with research as product and felt if instead of doing research with intent of looking smart, we examined what stakeholders actually needed
—> We started doing user-centered design focused on stakeholders
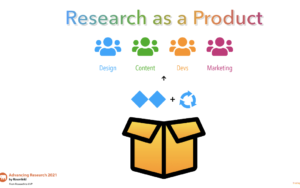
—> As a result, I had stakeholders who were engaged throughout the process
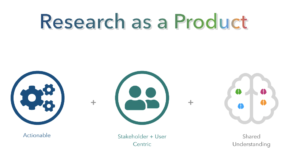
—> For him, research as a product is something that is actionable, and usable
—> End consumer of my products are the stakeholders
—> No deliverables, but my focus is on shared understanding and want to share it immediately
—> So I did this research at Canon and Autotrader, where stakeholders at both companies had conception that personas that needed to be produced were of a driver or a professional photographer
—> Since stakeholders were vocal about how they didn’t believe in personas, I wanted to get personas accurate
-
But I was new, and didn’t know where to start
-
I also needed to find statistically valid numbers of people
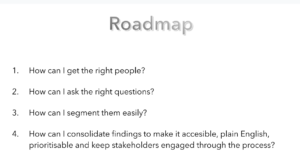
—> I built the roadmap above to help address these issues
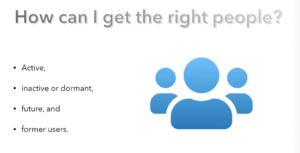
—> Focus was on finding active/dormant/future/former users
—> Depending on business strategy, you might have to look at certain users more than other ones
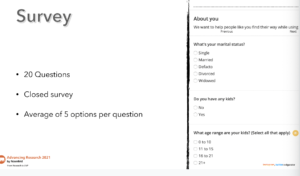
—> So I created a survey and made clusters of data, but how to ask the right questions?
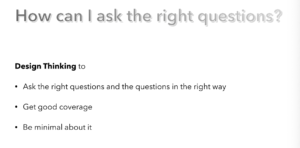
—> Focused on design activity of proto-personas and a quintuple design thinking diamond
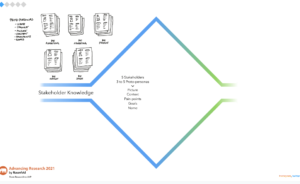
—> I asked participants to create 3-5 personas with context of personas, the pain-points, goals,
—> Then, I shared the personas with stakeholders
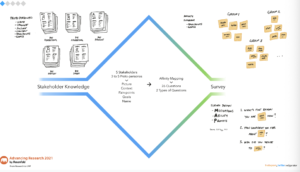
—> Concept form personas were collected in affinity map, and then each group was included in the question in the survey
—> Gave right coverage for survey, and prevented departmental bias
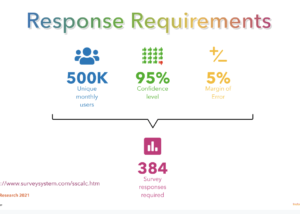
—> Both companies had over 500k users, and needed over 95% confidence level, so needed 384 responses
—> This would be a lot of data to organize manually
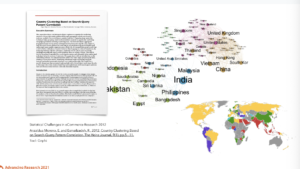
—> Clustered countries based on number of visits they had based on key word that was used to get to websites
—> Needed to quantify it and realized whether average, and quantified data according
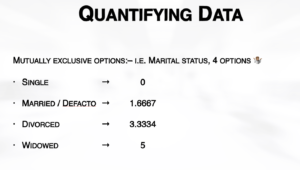
—> Became more complicated when new values appeared, so we built a scale of 1-4 to classify life events
—> However, clusters were not great, and needed to figure out what went wrong
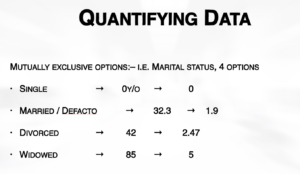
—> Came up with idea to figure out typical age people went through life events, and then scaled ages from 0-5 and implemented clusters
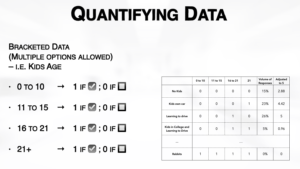
—> Kept going with multiple options, and was created number of answers based on a combination, and volume from combination of answers
-
0 for least popular
-
10 for most popular
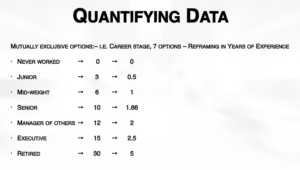
—> For non-quantifiable data, needed to be creative, so used years of expereicne to capture things like career background
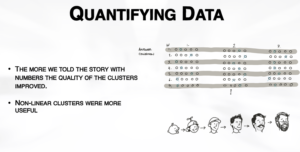
—> The more we told the story with numbers, the more the quality of the clusters improved
—> So how did we do this?
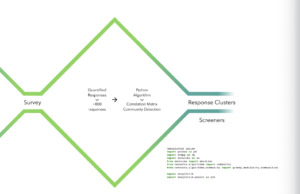
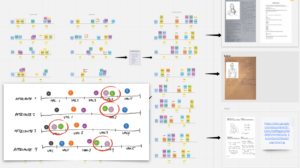
—> I had 800 responses from surveys sent out , and used Python algorithm to consume all answers.
—> I then produced a correlation matrix to detect communities within the answers
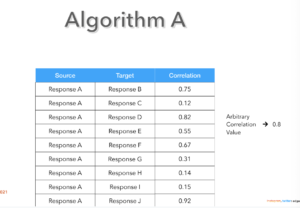
—> Algorithm A said we compared each response against all others .
—> Filtered out all answers below 0.8
—> Began connecting lines to each other
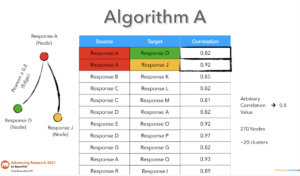
—> Kept going but problem faced was that they found only 270 response out of 20 clusters didn’t exist.
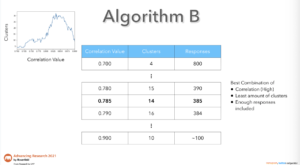
—> Instead, started looking at clusters for each correlation value with goals of finding highest correlation value with least amount of clusters
—> Got 385 responses
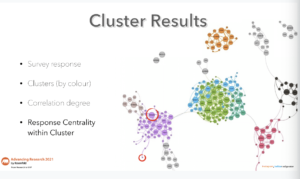
—> Each circle in slide refers to a response, and correlation was line between clusters, and thickness showed weight of correlation
—> Size of response was how representative response was from group perspective
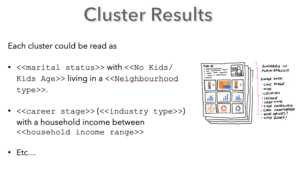
—> Cluster’s were described as number of sentence that could describe a user (Single with no kids, in suburban area)
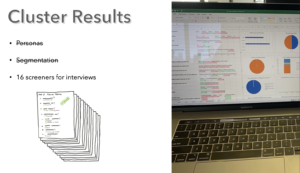
—> After all this, realized this was just initial audience to interview, as we asked behavioral/demographic data for the audience
—> Made 14 screeners
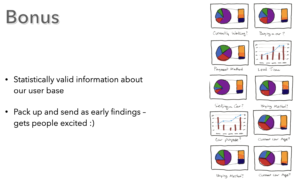
—> Created statistically valid information about the user base, and gave to stakeholders and the stakeholders were super happy
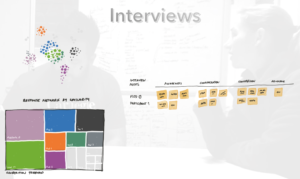
—> Had budget for 13 interviews, so planned number of interviews according to each cluster we had
—> Semi-structured interviews focused on awareness, consideration, conversion, and advocacy
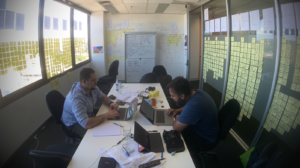
—> After all interviews, got 1300 sticky notes stuck on the wall,
-
A lot of info
-
And hard to consume
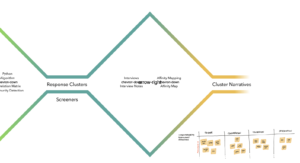
—> So w reduced per cluster, with an affinity diagram to create a cluster narrative (a diary study written in way to detect pain-points and emotional states)
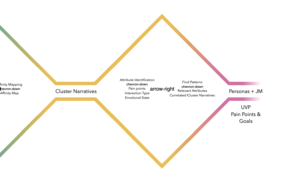
—> From all of this, we found patterns across the response and if doing job could reduce demographic and behavioral clusters into emotional personas to identify a value proposition for the company
—> Did this by looking at different attributes personas exhibited, and values for each attribute
—> Then looked for patterns to show what was together for one attribute to another
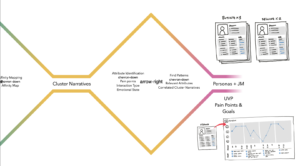
—> Since they documented all pain points and goal, could then transform persona into a journey map
—> Once journey map was set up, to see where people had pain points in car buying process and goals per persona
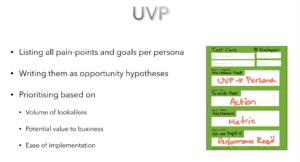
—> Written as opportunity hypotheses, prioritized based on volume of look-alikes, value of business, and ease of implementation
—> Have three values and could prioritize what was needed
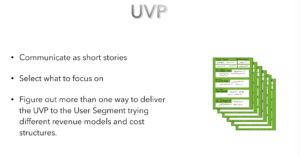
—> Now, after looking at shared stories of value propositions, and reduced it to a working set, for what makes sense to work on
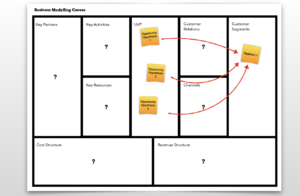
—> Different boxes were for different kinds of information, and put cards written, and how value proposition can be delivered for a user segment
-
Had some variables in boxes, and interested in how different stakeholders would tackle problem
-
Let us come up with solutions to same problem
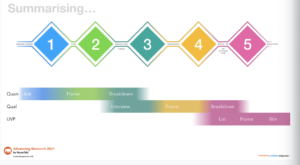
—> To summarize quantitative track to figure out what needed to be done for survey, and coming up with survey population
—> Next, using population shown by algorithm to interview people, and break responses down into personas
—> Identify delivery of value proposition, then succeeded in delivering the value proposition
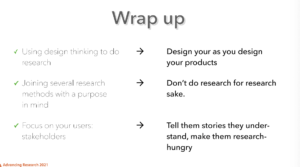
—> Takeaways
-
Figure out if researchers design research the way they design their products
-
Don’t do research for researcher’s sakes, and join several research methods with a purpose in mind
-
Focus on stakeholders, and tell them stories they understand, and making them research hungry

Q&A
- “Are there any methods your team uses to try to avoid bias being introduced into the persona creation process?”
A: Haven’t done it, but try to conscious about biases
-
How were demographics picked? Why did marital status matter?
A: For company, noticed that people buy cars based on life-stage they are at

